

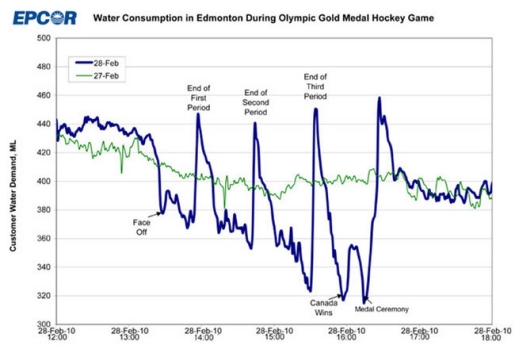
Among all the events at the Vancouver 2010 Winter Olympics, nothing was as popular in the home country as was the hockey. Specifically, the men’s hockey gold medal game between the United States and Canada, which set all kinds of viewing records on both sides of the border. If you take one look at this fascinating water usage chart released by EPCOR, the Edmonton water department, you can actually see on a timeline where the periods ended and where Canadians rushed to the bathroom as a group.
It’s like everyone in Canada flushed their toilets all at once! No doubt, it’s due to all that beer consumed. Comparing the game night to the previous day, you can see that the spikes and dips in water usage on gold medal day are pretty spectacular when compared to a normal day’s water use. It’s pretty funny to see just how many people rushed to the potty between periods, and just how few people left their seats during the medal ceremony.
Tags: EPCOR, Edmonton, water usage chart, Vancouver Olympics, gold medal game in Olympic hockey, Team Canada, water usage spikes and televised sports, biggest event in Canadian history


